
Understanding PC Hardware Monitoring Readings
Overseer monitors CPU, GPU, RAM and storage information on Windows. This guide explains how common hardware-monitoring readings should be interpreted, whether you use Overseer or are simply researching Windows hardware monitoring software.
Sensor availability varies by hardware, firmware, drivers and manufacturer support. A reading that appears on one PC may be unavailable on another, even when both systems are working normally.
New to Overseer? Start with the Getting Started guide.
CPU Monitoring
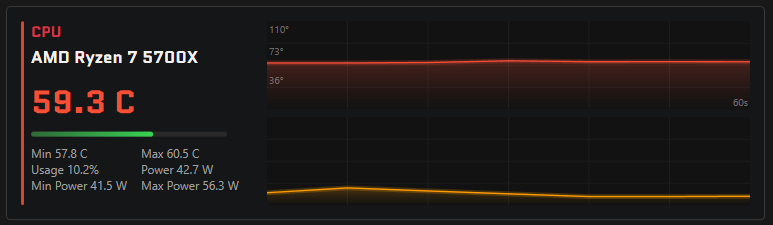
CPU Temperature
CPU temperature represents the heat reported by sensors in or near the processor. It changes constantly because clock speed, voltage, workload, cooling behavior and ambient room temperature all change while the PC is running.
Idle temperatures are usually lower than load temperatures, but brief spikes are normal. Opening an application, loading a game, compiling code or scanning files can make a CPU temperature jump for a moment before the cooling system catches up.
Desktop and laptop behavior can look different. A desktop tower may have larger coolers and more airflow, while a laptop often runs warmer because it has less physical cooling space. Sustained high CPU temperatures during light use are worth investigating, especially if fans are loud or performance drops.
Cooling, airflow, dust buildup, thermal paste contact and heatsink mounting can all affect CPU temperature. Manufacturer specifications for your exact processor and system should take precedence over generic temperature rules.
CPU Usage
CPU usage is the percentage of available CPU computing capacity currently being used. High CPU usage is not inherently bad. Short spikes to 100% can be normal when Windows, a game or an application has work to finish quickly.
In games, CPU usage depends on the engine, graphics settings, background tasks and frame rate limits. High CPU usage together with lower GPU usage can sometimes suggest a CPU-limited workload, but it should not be treated as a definitive bottleneck diagnosis by itself.
CPU Power
CPU package power is a reported estimate of how much electrical power the processor package is using. It normally rises as workload, voltage and clock speeds increase.
Not all CPUs, laptops or motherboards expose usable power telemetry to hardware monitoring software. Missing CPU power telemetry is not necessarily a fault. Overseer should leave the value unavailable when hardware does not report it instead of implying a false zero or estimate.
GPU Monitoring
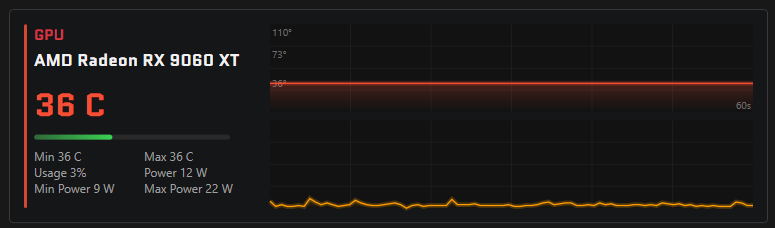
GPU Temperature
GPU temperature is the heat reported by the graphics processor or graphics device. Gaming, rendering, video encoding and AI workloads can raise GPU temperature because the chip is doing sustained parallel work.
Desktop graphics cards, laptop GPUs and integrated GPUs can report temperatures differently. Some desktop cards also use zero-RPM fan modes, where the fans remain stopped at low temperatures and begin spinning only when load or heat increases.
Thermal throttling happens when a GPU reduces clocks or power to stay within its operating limits. Exact limits vary by model, so the manufacturer specifications for your GPU should take precedence over universal temperature claims.
GPU Usage
GPU usage describes how much of the graphics processor is being used at that moment. Near-100% GPU usage in games can be completely normal and often means the GPU is being fully used to render frames.
Low GPU usage is not always a hardware problem. It can result from CPU limitations, V-Sync, frame caps, game-engine limits, background throttling, laptop power-saving settings or a workload that simply does not need much GPU power.
GPU usage is best interpreted together with CPU usage, temperatures, power behavior and the performance of the application you are actually running.
GPU Power
Reported GPU power represents power telemetry exposed by the graphics hardware and driver. It usually rises under 3D, compute, rendering or AI load.
Integrated GPUs and many laptop GPUs may not expose separate GPU power telemetry. Unavailable readings should not be treated as zero, because no reported value is different from a device reporting no power use.
RAM and Memory Monitoring
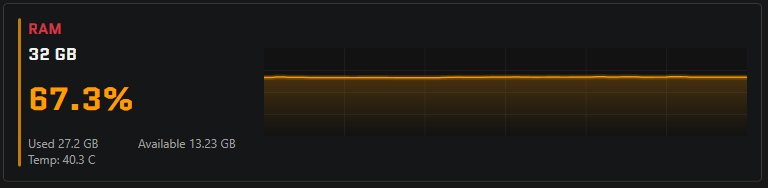
RAM Usage
RAM usage compares used memory with total installed memory. A system with 18.2 GB used out of 32 GB installed is using about 57% of its memory.
Windows deliberately uses RAM for active applications, file caching and system services. High RAM usage alone does not automatically mean there is a problem.
Very low available memory can lead to more paging, where Windows moves data between RAM and storage. In games and large applications, heavy paging may contribute to stutter, slow loading or general sluggishness.
Available Memory
Available memory is not simply "completely empty RAM." It includes memory Windows can quickly reclaim from caches and standby data when applications need it.
That makes available memory more useful than looking only for unused RAM. A system can be healthy while actively using memory for cache, as long as enough memory remains available for current work.
RAM Temperature
Only some memory modules expose readable temperature sensors. Availability differs by DIMM, motherboard, memory generation and monitoring-library support.
Missing RAM temperature is normal on many systems and should not be treated as a fault by itself.
SSD, HDD and NVMe Health Monitoring
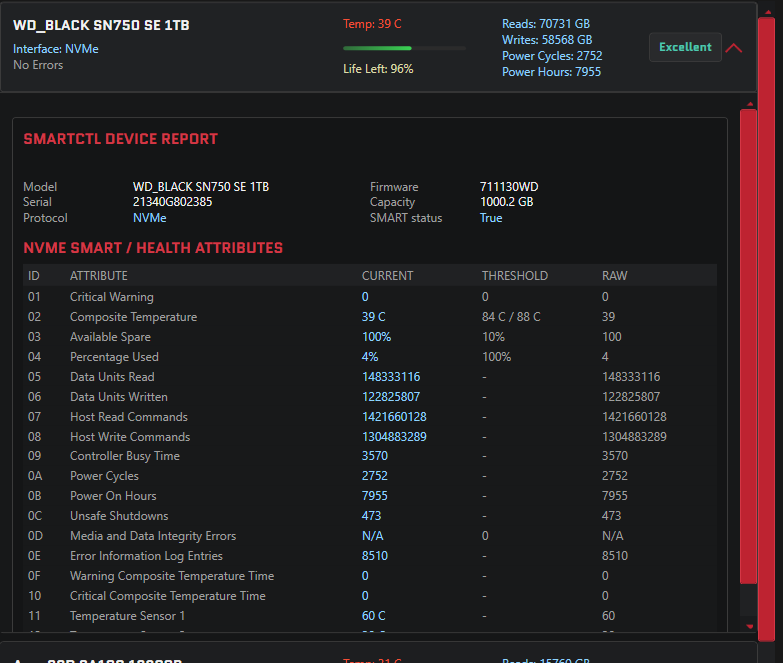
Drive Temperature
HDDs, SATA SSDs and NVMe SSDs can behave differently under load. Mechanical hard drives usually warm gradually, while NVMe drives may become noticeably warmer during sustained reads, writes, game installs, backups or file transfers.
For a specific drive, use the manufacturer's operating specifications rather than a universal temperature rule.
Drive Health
Drive health is based on telemetry reported by the storage device. Depending on the drive, health data may include remaining life, SMART information, NVMe warnings, spare capacity and error counters.
A "Healthy" status is useful, but it is not a guarantee that a drive cannot fail. Storage warnings should prompt investigation and backup verification, especially when important data is involved.
What is SMART?
SMART stands for Self-Monitoring, Analysis and Reporting Technology. It is commonly associated with SATA hard drives and SATA SSDs.
SMART attributes can include reallocated sectors, temperature, power-on hours, power cycles, wear indicators and errors. Some attributes are vendor-specific, and raw SMART values should not always be directly compared between different manufacturers or models.
NVMe Health Information
NVMe health reporting is different from traditional ATA SMART attribute tables. When available, NVMe telemetry may include percentage used, available spare, critical warnings, data read, data written, power cycles, power-on hours, unsafe shutdowns, media and data integrity errors and error log entries.
Power-On Hours
Power-on hours are a cumulative lifetime statistic reported by the drive. The count does not reset when Overseer restarts. It can be useful context when evaluating used hardware, but it is not a direct estimate of remaining lifespan.
Power Cycles
Power cycles count how many times a drive has been powered on. They are primarily informational and are most useful when viewed with other health data.
Host Reads and Writes
Host reads and writes describe cumulative data transferred between the computer and the storage device. These readings can help explain SSD usage and wear, but exact units and reporting behavior vary by storage technology and manufacturer.
Unsafe Shutdowns
Unsafe shutdowns usually indicate unexpected power loss or abnormal shutdown events. Examples include a crash, forced shutdown, battery depletion, power loss or hardware reset.
A nonzero unsafe shutdown count does not automatically mean the drive is damaged. Repeated unexplained increases are more worth investigating.
Media and Data Integrity Errors
Media and data integrity errors broadly represent errors related to reading, writing or preserving data correctly. Nonzero values deserve attention, and increasing counts are more concerning than a static historic value.
Important data should be backed up if storage errors are appearing or increasing.
How to Interpret Hardware Temperature Warnings
Overseer uses visual states to make potentially unusual temperatures easier to notice. These indicators are general monitoring aids, not universal safety limits for every CPU, GPU, SSD or memory module.
Hardware model, manufacturer limits, cooling design, ambient temperature and workload all matter. Manufacturer specifications should take precedence when interpreting hardware temperature warnings.
Session History, Status and Alerts
The Temps view keeps session minimum and maximum values alongside current readings. CPU, GPU, memory and drive charts show recent movement, which can make a sustained change easier to distinguish from a brief spike.
Overseer uses Normal, High, Critical and Unavailable states to make the displayed data easier to scan. Unavailable is neutral: it means no supported sensor value was obtained, not that a zero value was measured or that a warning condition exists.
Alert sounds can call attention to sustained temperature or drive health conditions. They are monitoring aids, not universal hardware safety limits. Always use the specifications for the exact device when deciding whether a temperature or warning needs action.
Final Note on Sensor Accuracy
Overseer reports telemetry exposed by the hardware, drivers and supported monitoring interfaces. Sensor availability and accuracy can differ between systems, so readings should be interpreted as reported hardware telemetry rather than as a guarantee of hardware condition or future reliability.
If you are setting up Overseer for the first time, you can download the latest release or review the GitHub repository.